FX Series Programmable Controllers
Object Function Description 8
8-12
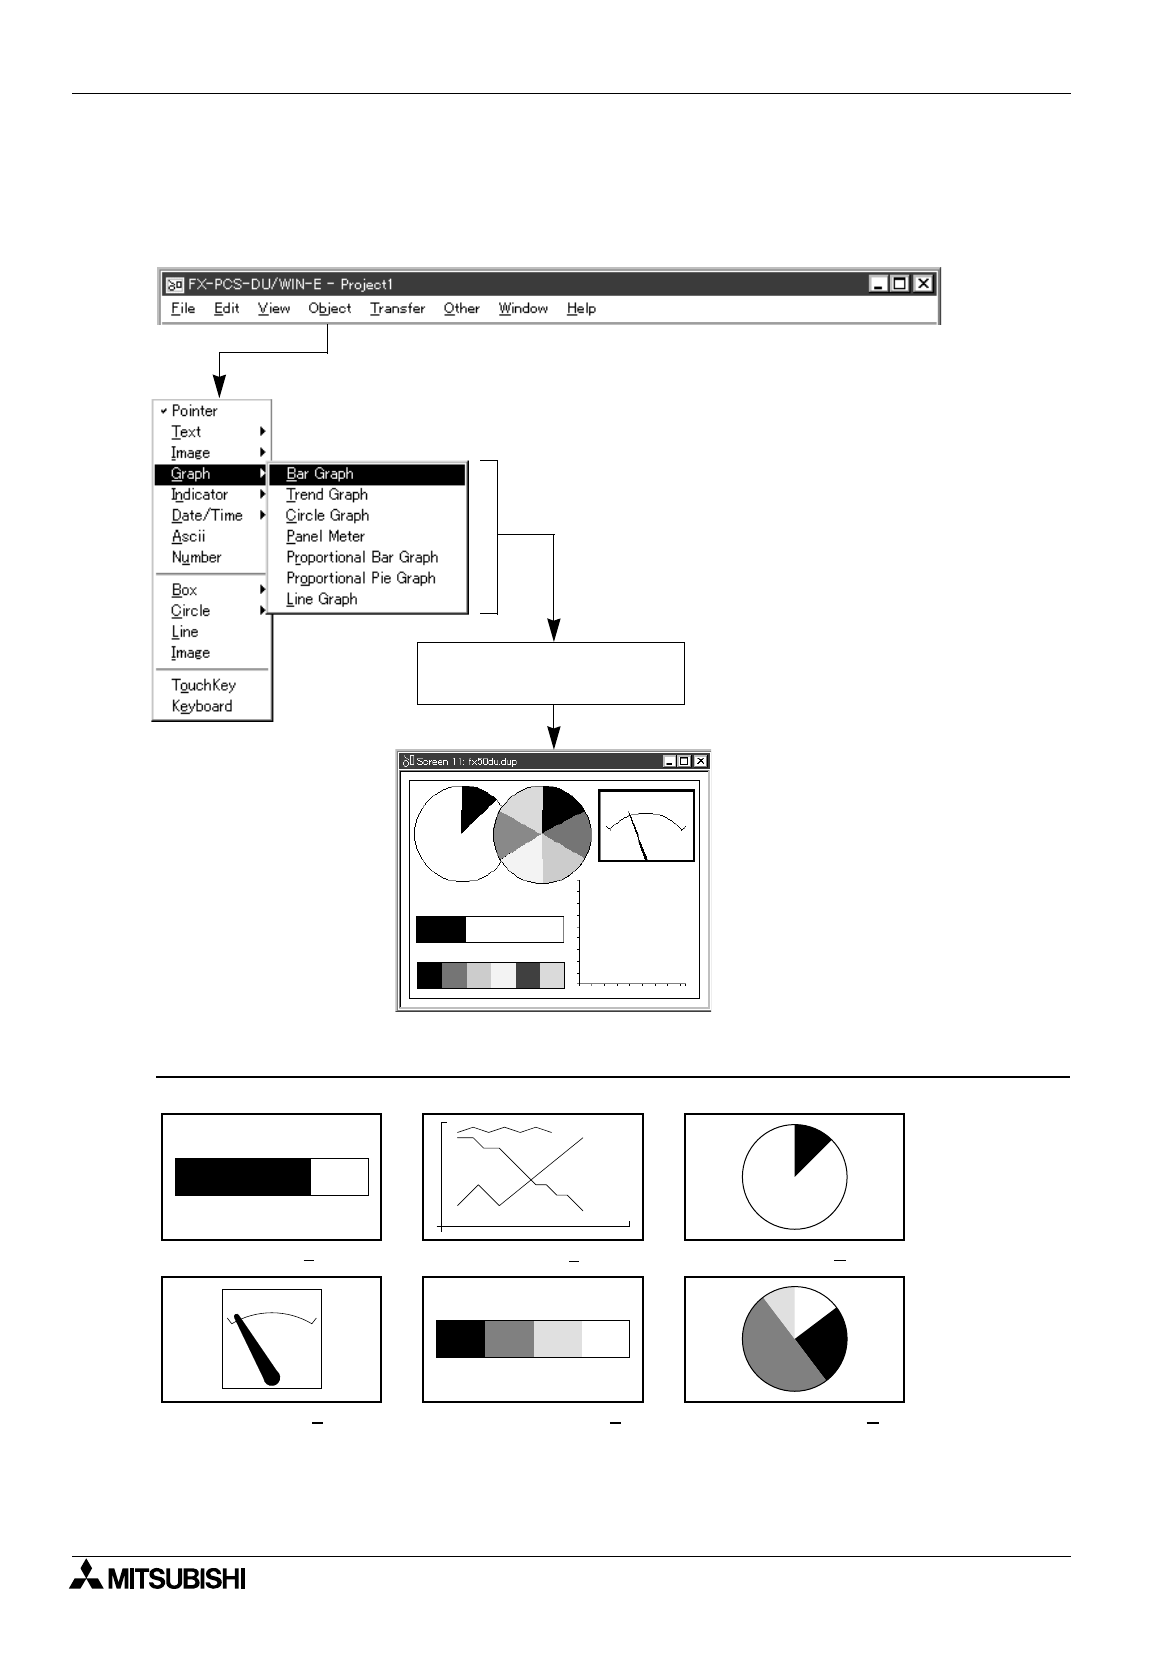
8.3 Setting the "Graph" object
The "Graph" object allows to display diversified graphs on the DU screen.Each graph is displayed as the ratio
against the value of the specified word device.
Description on the objects
Submenu is displayed.
Select either object.
Click the start point on the
screen window.
[Bar Graph(B)]
0 100
[Trend Graph(T)]
[Circle Graph(C)]
[Panel Meter(P)] [Proportional Bar Graph(R)] [Proportional Pie Graph(O)]


