4-44
Performance Tests
12. Test Port Input Impedance
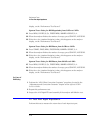
display, on the “Performance Test Record.”
System Trace Noise for B/R Magnitude from 3 GHz to 6 GHz
21
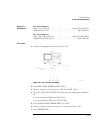
Press
MENU
,
CW FREQ
,
6
,
G/n
,
TRIGGER MENU
,
NUMBER of GROUPS
,
5
,
x1
.
22
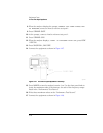
When the analyzer finishes the number of sweeps, press
SCALE REF
,
AUTO SCALE
.
23
Write the s.dev (standard deviation) value, which appears on the analyzer
display, on the “Performance Test Record.”
System Trace Noise for B/R Phase from 3 GHz to 6 GHz
24
Press
FORMAT
,
PHASE
,
MENU
,
TRIGGER MENU
,
NUMBER of GROUPS
,
5
,
x1
.
25
When the analyzer finishes the number of sweeps, press
SCALE REF
,
AUTO SCALE
.
26
Write the s.dev (standard deviation) value, which appears on the analyzer
display, on the “Performance Test Record.”
System Trace Noise for B/R Phase from 30 kHz to 3 GHz
27
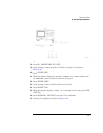
Press
MENU
,
CW FREQ
,
3
,
G/n
,
TRIGGER MENU
,
NUMBER of GROUPS
,
5
,
x1
.
28
When the analyzer finishes the number of sweeps, press
SCALE REF
,
AUTO SCALE
.
29
Write the s.dev (standard deviation) value, which appears on the analyzer
display, on the “Performance Test Record.”
In Case of
Difficulty
1
Perform the “ADC Offset Correction Constants” procedure, located in the
“Adjustments and Correction Constants” chapter of the
Agilent 8753D
Service Guide
.
2
Repeat this performance test.
3
Suspect the A10 Digital IF board assembly if the analyzer still fails the test.
12. Test Port Input Impedance
Perform this test to measure the return loss of each input test port.


