


M400E Ozone Analyzer Operator’s Manual 346BEPA Protocol Calibration
10.3.3. DYNAMIC MULTIPOINT CALIBRATION CHECK
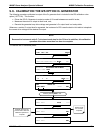
The EPA-prescribed calibration procedure is based on photometric assays of O
3
concentrations in a dynamic
flow system. It is based on the same principles that the M400E uses to measure ozone. The theory is covered
in Chapter 11 of this manual.
Since the a
ccuracy of the calibration standards obtained by this calibration procedure depends entirely on the
accuracy of the photometer, it is very important that the photometer is operating properly and accurately. The
fact that the photometer makes a ratio measurement (I/I
o
) rather than an absolute measurement eases this task.
The checks described in this section, if carried out carefully, will provide reasonable confidence that a
photometer which has the required inherent capability is operating properly. Checks should be carried out
frequently on a new calibrator, and a chronological record of the results should be kept. If the record of the
photometer performance shows continued adequacy and reliability, the frequency of the checks can be reduced
with no loss of confidence in the photometer. (The record, however, may indicate the need for continued
frequent verification of the system condition.) Even where the record shows excellent stability, the checks
should still be carried out monthly, as the possibility of malfunction is always present.
A well-designed properly built photometer is a precision instrument, and once it is operating adequately, it is
likely to continue to do so for some time, particularly if the photometer is stationary and is used intermittently
under ideal laboratory conditions. If the photometer is commercially manufactured, it should include an
operation/instruction manual. Study the manual thoroughly and follow its recommendations carefully and
completely.
10.3.4. LINEARITY TEST
Because the required photometric measurement is a ratio, a simple linearity check of the photometer is a good
indication of accuracy. Linearity of commercially made photometers may be demonstrated by the manufacturer.
The linearity test is conducted by first generating and assaying an ozone concentration near the upper range
limit (80% of full scale is recommended) of the reporting range in use.
Other data points can be created by adding zero air (F
d
) to the flow of originally generated concentration (F
o
) and
pass the mixture through a mixing device to ensure a homogeneous concentration at the Inlet to the analyzer
being calibrated.
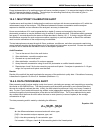
The First step of performing this linearity test is to determine the dilution ration of the various test points
according to the following formula:
Equation 10-1
)FF(
F
R
do
o
+
=
For this test, the flow rates F
o
and F
d
must be accurately measured within ±2% of the true value. To help ensure
accurate flow measurements, the two flowmeters should be of the same general type and one should be
standardized against the other. The dilution ratio R is calculated as the flow of the original concentration (F
o
)
divided by the total flow (F
o
+ F
d
).
With stable, high resolution flowmeters and with careful technique, R should be accurate to within 1%.
04315 Rev. C1 177