


57
EN
(English)
Generating an Instrument Temperature Log report
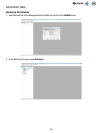
1. To generate an Instrument Temperature Log report, which lists the instrument’s temperature at 5 second intervals during
all runs, select Reports on the menu bar, and then select Instrument Temperature Log… You can also click Generate
Reports next to the Generate Reports icon on the Start page, or your can click Generate Reports next to the
Generate Reports icon on the Sidebar to generate an Instrument Temperature Details report.
2. Select Instrument Temperature Log… from the list of reports that appears.
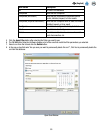
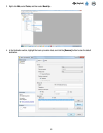
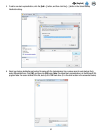
3. When the Instrument Temperature Details report window appears, select the date range to include and select the filter
parameters you want to use and the values for the filter parameters you selected.
a. Select the All dates option to include test results done on any date, or select the Date range option to include
test results done within a range of dates. If you select the Date range option, enter the start and end dates by
entering them directly or selecting them though use of the calendar. The default option is the date range including
the past week.
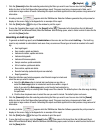
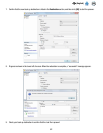
b. The filter parameters on the Instrument Temperature Log report window are both optional. Click the dropdown
menu and select the values you want include in the Instrument Temperature Log report. The defaults are all run
IDs and all instruments.
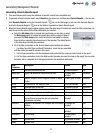
Filter
Parameter
Description Default Type
Run ID ID assigned to the run when it was set up (only
completed runs are listed, oldest runs first)
All runs included List
Instrument Serial number of the instrument on which the test
was done (connected and not connected instru-
ments are listed)
All instruments
included
List
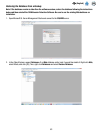
4. Click the [Generate] button after selecting and entering the filters you want to use. You can also click the [Cancel]
button to return to the Start Page without generating a report. This query must scan a large amount of data, and it
could return a large number of results. Generating this report could take significant time and produce a large amount of
information.
5. A loading indicator appears while the 3M Molecular Detection Software generates the print preview for
display on the screen. Refer to the Appendix for an example of this report.
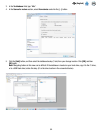
6. Click the [Print] button at the top of the window to print the report.
7. To save the Instrument Temperature Log report, click the [Export] button then select a file format from the list
(Microsoft Excel, Adobe PDF and Microsoft Word). When the Windows Save As dialog opens, select a folder in which to
store the file and click the [Save] button.