


46
EN
(English)
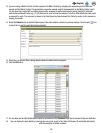
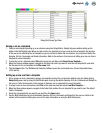
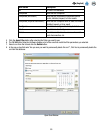
11. You can choose to select and display the graph for any or all of the wells.
a. Right-click or Ctrl-click an individual well to select and display the graph for that well. The background color of
the selected well changes from gray to light blue to indicate the well is selected, and the curve for the selected
well appears on the graph.
b. Right-click a selected well to de-select it and remove the graph for that well.
c. Right-click additional wells to select and display the graphs for the additional wells. The display is cumulative.
The curves for all selected wells appear on the graph.
d. Hold Ctrl and left-click and drag over a group of wells to select and display the graphs for multiple wells. The
curves for all selected wells appear on the graph.
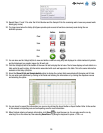
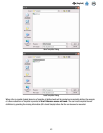
12. You can left-click a selected well, or left-click and drag over a group of wells, to highlight the curve(s) for that well(s). You
can also left-click a curve to highlight the corresponding well.
13. You can customize the appearance of the graph as follows:
• Click the Select all button display the curves for all defined wells.
• Click the Clear button to reset well selections and display no curves.
• Click the Zoom in button to enlarge the graph by one level. This can also be performed by hovering over the
graph and using the mouse wheel.
• Click the Zoom out button to shrink the graph by one level.
• Use the Mouse Wheel while hovering the cursor over the graph to zoom in or zoom out on the graph.
• Click the Fit to view button to perform a best fit for the selected plots.
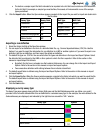
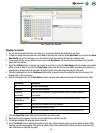
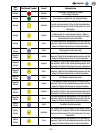
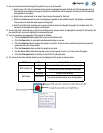
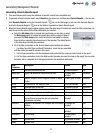
14. The colors of the wells indicate which curves are displayed on the graph, as shown below.
Well Area Color Interpretation
Well Background
Gray The curve for this well is not shown on the graph
Blue The curve for this well is shown on the graph
Well Border
No border The well is not selected
Blue border
The well is selected and its curve is highlighted