


44
EN
(English)
Run Created From Template
Viewing run results
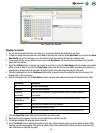
1. You can use the Results-Grid view to monitor a run in progress. Results are displayed in real-time.
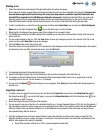
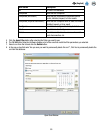
2. To view run results from previous runs, select File on the menu bar, and then select Open Runs. You can also click View
Run Results icon on the Start page, or on the Sidebar to view the results of the last five completed runs.
3. If you cannot find the run your want do view, you can use Run filters to set the plate filter parameters. All of the filter
parameters are optional.
4. Select the All Dates option to include runs created on any date, or select the Date Range option to include runs created
within a range of dates. If you select the Date Range option, enter the start and end dates by entering them directly or
selecting them though use of the calendar. The default option is the date range including the past week.
5. Click the dropdown menu for the Technician field to select a specific user who created the runs to be included. The
default option is the current user.
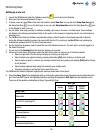
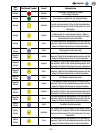
6. Click the dropdown menu for the Run Status to select a specific plate state to be included. The default option is All.
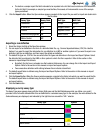
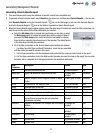
Run Status Description
All All runs in the database
Completed Runs that are completed
Completed
(successful)
Runs that are successfully completed without Invalid, Inhibited, Inspect, or
Error results
Completed (requires
examination)
Runs that are completed with at least one Invalid, Inhibited, Inspect, or Error
result
Configured Runs that are configured but not yet started
Abort Runs that are aborted by a user
Failed Runs that are failed due to errors such as instrument disconnection, etc.
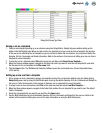
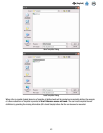
7. Click the Apply Filter button after selecting the filters you want to use.
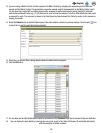
8. When the list of runs appears, click the run you want to view, and then click OK.
9. The software displays the selected run on a new tab.
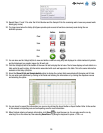
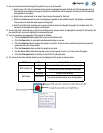
10. Select the Results (Grid) to display the results for each well. A table of result symbols is shown below. A graph of RLU
readings over time also appears if this option is enabled. Refer to the Administrative Options section in this manual for
more information on enabling the graph.