


4-62
Multiple Instance Spanning-Tree Operation
Troubleshooting an MSTP Configuration
Displaying Debug Counters for One MST Instance
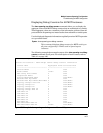
The show spanning-tree debug-counters instance command allows you to dis-
play the aggregate values of all MSTP debug counters maintained on a switch
for a specified spanning-tree instance. These aggregate values are a summary
of information collected from all ports that have VLANs assigned to the
specified instance.
Use the show spanning-tree debug-counters instance command to troubleshoot
the global MSTP diagnostic information displayed in show spanning-tree
debug-counters command output when you suspect unauthorized MSTP activ-
ity in a specific MST instance.
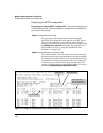
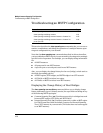
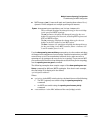
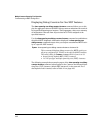
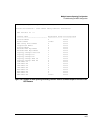
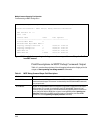
The following example shows sample output of the show spanning-tree debug-
counters instance command when applied to the Common and Internal Span-
ning Tree (CIST) instance (default MST instance 0) in the network. For a
description of each counter, refer to Table 4-1 on page 4-66.
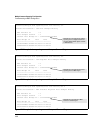
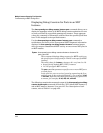
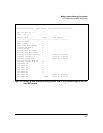
Syntax: show spanning-tree debug-counters instance <instance-id>
This command displays debug counters for MSTP activity on
all ports configured for VLANs in the specified MST instance.
The valid values for instance <instance-id> are from 0 to 16:
• 0 specifies the default MST (CIST) instance.
• 1 to 16 specify a multiple spanning-tree (MST) instance.