


4-61
Multiple Instance Spanning-Tree Operation
Troubleshooting an MSTP Configuration
Displaying Debug Counters for All MST Instances
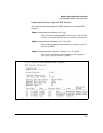
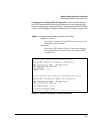
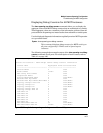
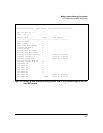
The show spanning-tree debug-counters command allows you to display the
aggregate values of all MSTP debug counters that are maintained on a switch.
These aggregate values are a summary of the information collected from all
ports and from all spanning-tree instances that forward traffic on switch ports.
Use the displayed diagnostic information to globally monitor MSTP operation
on a per-switch basis.
The following example shows sample output of the show spanning-tree debug-
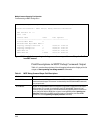
counters command for all ports. For a description of each counter, refer to
Table 4-1 on page 4-66.
Figure 4-25. Example of show spanning-tree debug-counters Command Output
Syntax: show spanning-tree debug-counters
This command displays debug counters for MSTP activity on
all ports configured for VLANs used in spanning-tree
instances.
ProCurve(config)# show spanning-tree debug-counters
Status and Counters - MSTP Bridge Common Debug Counters Information
Counter Name Aggregated Value Collected From
--------------------------------- ---------------- --------------
Invalid BPDUs 0 CIST
Errant BPDUs 170927 CIST
MST Config Error BPDUs 0 CIST
Looped-back BPDUs 0 CIST
Starved BPDUs/MSTI MSGs 0 CIST/MSTIs
Exceeded Max Age BPDUs 0 CIST
Exceeded Max Hops BPDUs/MSTI MSGs 0 CIST/MSTIs
Topology Changes Detected 2 CIST/MSTIs
Topology Changes Tx 6 CIST/MSTIs
Topology Changes Rx 4 CIST/MSTIs
Topology Change ACKs Tx 0 CIST
Topology Change ACKs Rx 0 CIST
TCN BPDUs Tx 0 CIST
TCN BPDUs Rx 0 CIST
CFG BPDUs Tx 0 CIST
CFG BPDUs Rx 0 CIST
RST BPDUs Tx 0 CIST
RST BPDUs Rx 0 CIST
MST BPDUs/MSTI MSGs Tx 10 CIST/MSTIs
MST BPDUs/MSTI MSGs Rx 341802 CIST/MSTIs