


2-47
Cisco NetFlow Collector User Guide
OL-11399-01
Chapter 2 Using the NetFlow Collector User Interface
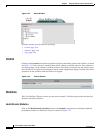
Status
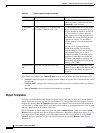
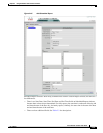
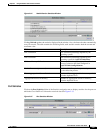
Figure 2-34 Health Monitor Statistics Window
Clicking Refresh updates the statistics displayed in the window. Also, the form refreshes automatically
every 30 seconds. The table contains the following fields; each statistic contains both the current and
maximum value.
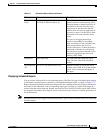
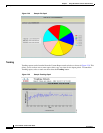
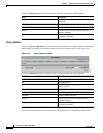
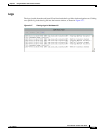
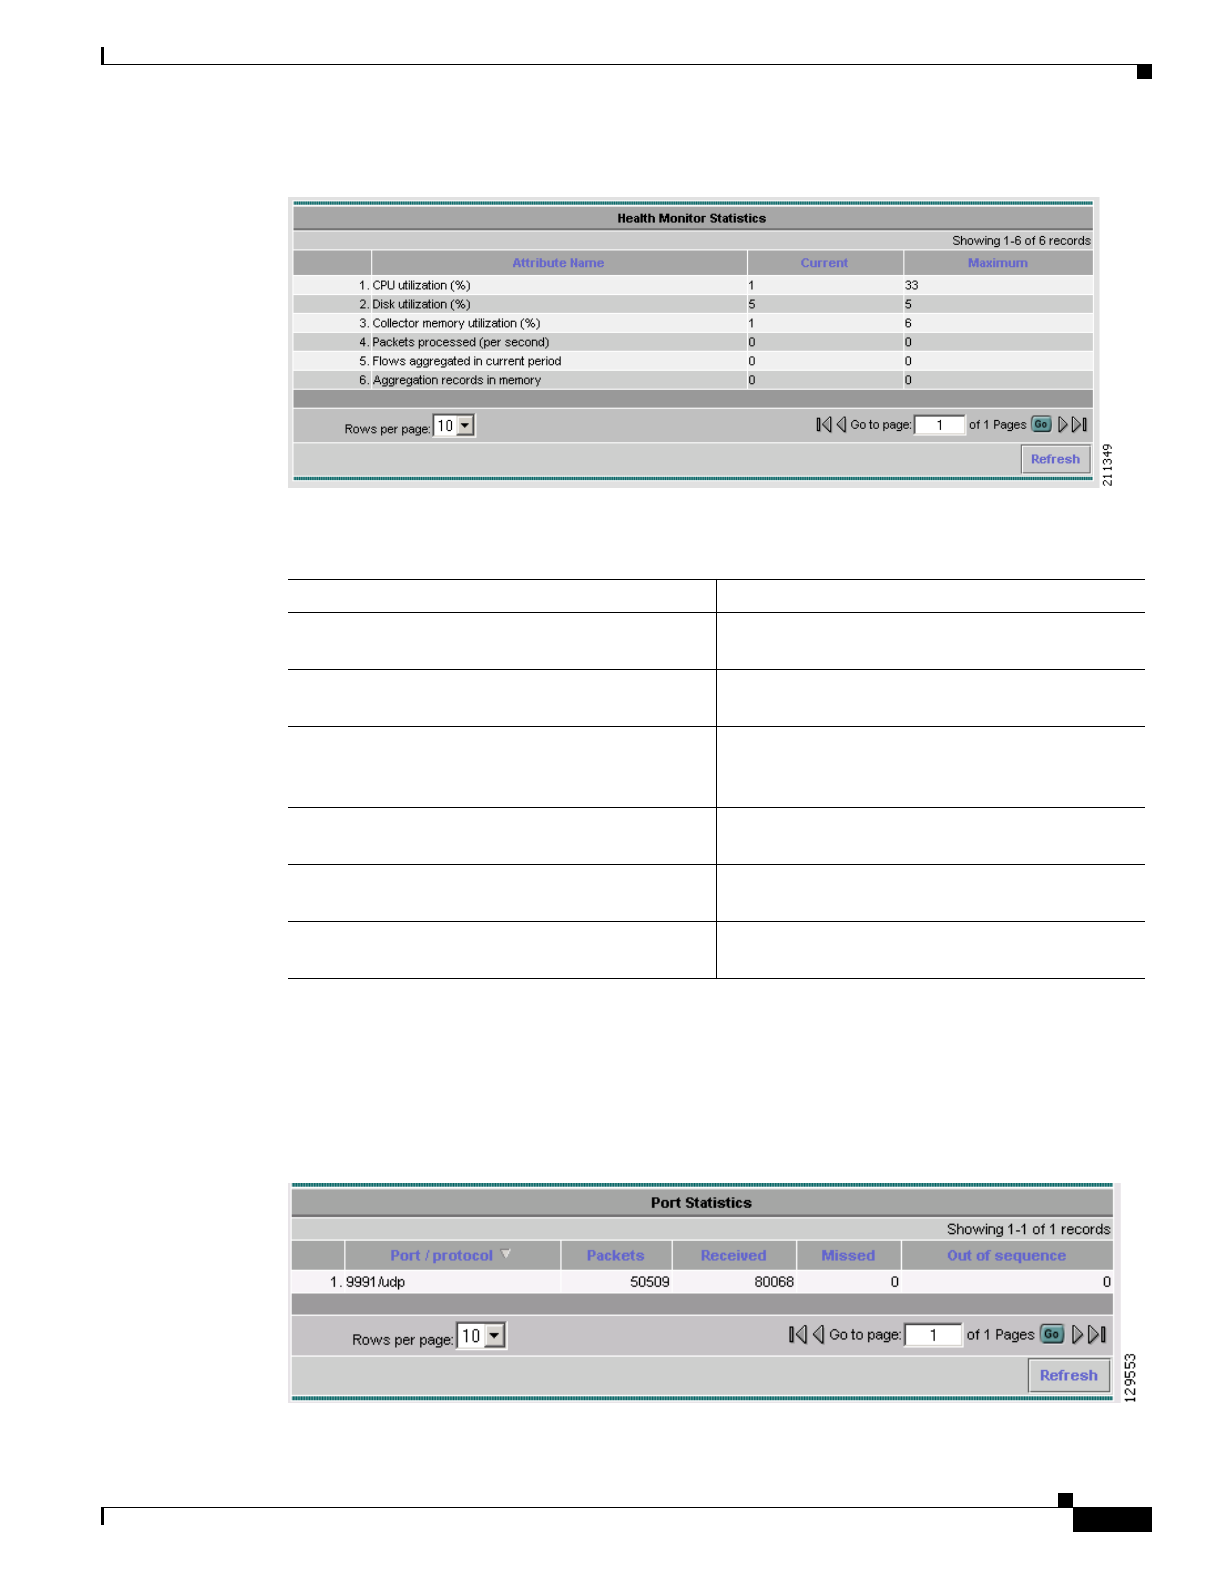
Port Statistics
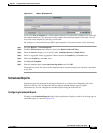
Click on the Port Statistics folder of the Statistics navigation tree to display statistics for the ports on
which the Cisco NetFlow Collector has received data. See Figure 2-35.
Figure 2-35 Port Statistics Window
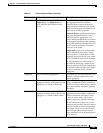
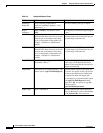
Field Description
CPU Utilization CPU utilization percentage reported by the
operating system.
Disk Utilization Disk utilization percentage reported by the
operating system for /opt/CSCOnfc/Data.
Collector Memory Utilization Memory utilization percentage of the collection
process, relative to the limit configured in
/opt/CSCOnfc/config/nfcmem.
Packets Processes (per second) Number of NetFlow packets processed per second
by the collection process.
Flows Aggregated in Current Period Number of flows aggregated in the current period;
includes duplicate flows.
Aggregation Records in Memory Number of aggregation records in memory;
excludes duplicate flows.