


2-43
Cisco NetFlow Collector User Guide
OL-11399-01
Chapter 2 Using the NetFlow Collector User Interface
Reports
Sorting and Graphing
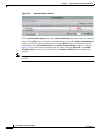
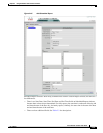
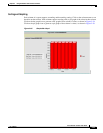
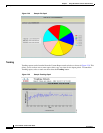
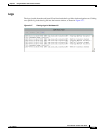
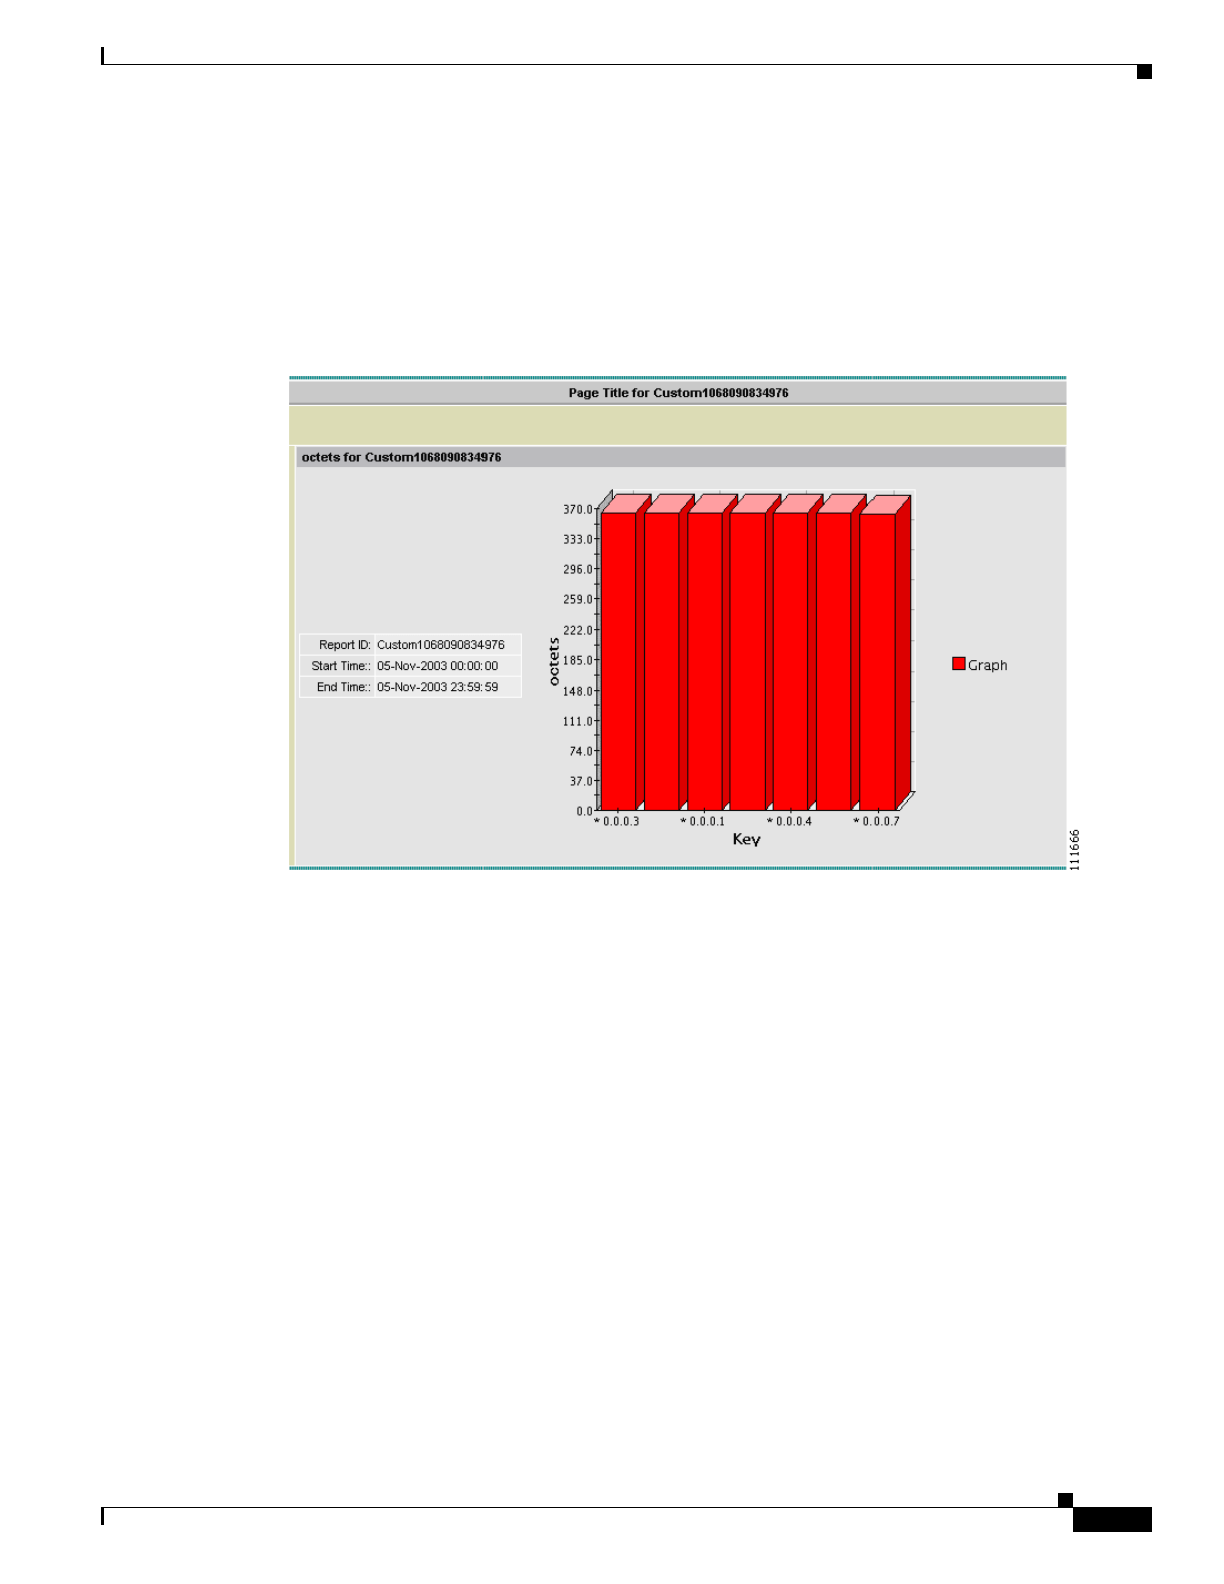
Each column of a report supports ascending and descending sorting. Click on the column name to sort
the table on that column. Value columns support creating a bar or pie graph of the values in that column.
Click on the bar graph icon to generate a bar graph of that column’s values, as shown in Figure 2-28.
Click on the pie graph icon to generate a pie graph of that column’s values, as shown in Figure 2-29.
Figure 2-28 Sample Bar Graph