


16
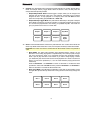
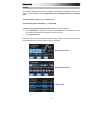
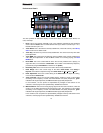
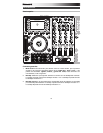
Performance View 2
This view provides an alternative display of information about the current track, effects, hot
cues, and loops.
1. Deck: This is the currently selected Layer in the software controlled by that hardware
deck. Press the Deck button to switch between the Layers. Deck A controls Layer 1 or 3;
Deck B controls Layer 2 or 4.
2. Track Name: This is the title the currently loaded track, which will scroll by. See Library
View to learn how to select tracks.
3. Track Key: This is the key of the currently loaded track. This is the track's key with a 0%
pitch adjustment.
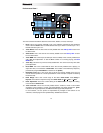
4. Track BPM: This is the tempo (in beats per minute or BPM) of the currently loaded track
with a 0% pitch adjustment. To see the BPM at which it is currently playing, see Deck
BPM below.
5. Deck BPM: This is the current BPM at which the currently loaded track is playing. To
adjust this value, move the deck's Pitch Fader. This number is not affected by temporary
pitch bends (using the Pitch Bend -/+ buttons or the platter).
6. Remaining Time: This is how much time is left of the currently loaded track.
7. Pitch Range: This is the current range of the deck's Pitch Fader. Press Range /
Keylock on that deck to adjust the range of its Pitch Fader to +8%, +16%, or +50%.
8. Pitch Adjustment: This is the current setting of the Pitch Fader. To adjust this setting,
move the deck's Pitch Fader.
9. Track Overview: This is the currently loaded track's waveform, which is color-coded
according to the frequency of each area: red indicates low (bass) frequencies, green
indicated mid-range frequencies, and blue indicates high (treble) frequencies.
In the waveform, hot cue points are represented by triangles at the bottom of the
waveform, and loop regions are represented by shaded-blue sections.
10. Main Waveform: This is the currently playing segment of the track's waveform, which will
scroll by as the audio playhead moves through the track. The waveform is color-coded
according to the frequency of each area: red indicates low (bass) frequencies, green
indicated mid-range frequencies, and blue indicates high (treble) frequencies.
In the waveform, hot cue points are represented by triangles at the top and bottom of the
waveform, and loop regions are represented by shaded-blue sections.
1 2 3
5
7
8
9
11
12
13
12
13
12
13
6
4
10
14