I
: ._,,’ . . . ,_
.-
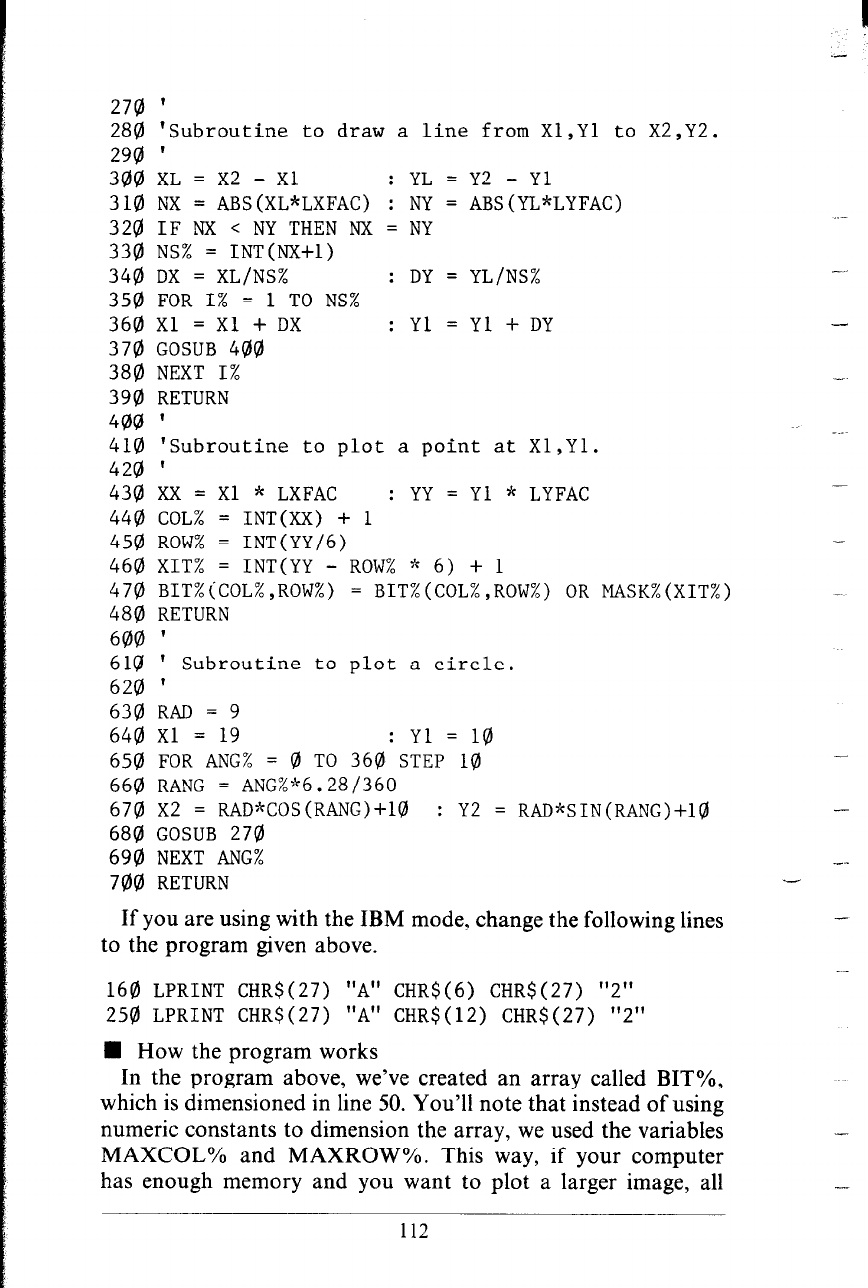
270 '
280 'Subroutine to draw a line from Xl,Yl to X2,Y2.
290 '
300 XL = x2 - xl : YL = Y2 - Yl
310 NX = ABS(XL*LXFAC) : NY = ABS(YL*LYFAC)
320 IF NX < NY THEN NX = NY
330 NS% = INT(NX+l)
340 DX = XL/NS% : DY = YL/NS%
350 FOR 1% = 1 TO NS%
360 Xl = Xl + DX : Yl = Yl + DY
370 GOSUB 400
380 NEXT 1%
390 RETURN
400 ’
410 'Subroutine to plot a point at Xl,Yl.
42Q '
430 xx = Xl * LXFAC : YY = Yl * LYFAC
440 COL% = INT(XX) + 1
450 ROW% = INT(YY/G)
460 XIT% = INT(YY - ROW% * 6) + 1
470 BIT%(COL%,ROW%) = BIT%(COL%,ROW%) OR MASK%(XIT%)
480 RETURN
600 ’
619 ' Subroutine to plot a circle.
620 '
630 RAD = 9
644) xl = 19
: Yl = 10
6541 FOR ANG% = Q TO 360 STEP 10
660 RANG = ANG%"6.28/360
670 X2 = RAD*COS(RANG)+lQ : Y2 = RAD*SIN(RANG)+lQ
680 GOSUB 270
690 NEXT ANG%
700 RETURN
--
-
-
~-
-
-
-
-
-.-
If you are using with the IBM mode. change the following lines
to the program given above.
-
160 LPRINT CHR$(27) "A" CHR$(6) CHR$(27) "2"
250 LPRINT CHR$(27) "A" CHR$(12) CHR$(27) "2"
n How the program works
In the program above, we’ve created an array called BIT%,
which is dimensioned in line 50. You’ll note that instead of using
numeric constants to dimension the array, we used the variables
MAXCOL% and MAXROW%. This way, if your computer
has enough memory and you want to plot a larger image, all
112