80
Chapter 5: Function Graphing
05FUNC.DOC TI-86, Chap 5, US English Bob Fedorisko Revised: 02/13/01 2:22 PM Printed: 02/13/01 3:01 PM Page 80 of 14
Setting the Graph Style in the Equation Editor
ᕡ
Display the equation editor.
ᕢ
Move the cursor to the function or functions for
which you want to set the graph style.
6 &
#
ᕣ
Display the equation editor menu item
STYLE
.
ᕤ
Select
STYLE
repeatedly to scroll the graph
style icons to the left of the equation name.
/
( (
ᕥ
View the graph with the new graph style.
ᕦ
Clear the
GRAPH
menu to view the graph only.
- *
:
Using Shading Patterns to Differentiate Functions
When you select
¾
(shade above) or
¿
(shade below) for more than one function, the TI
-
86
rotates through a series of four shading patterns.
♦
First shaded function: vertical lines
♦
Second shaded function: horizontal lines
♦
Third shaded function: negatively sloping diagonal lines
♦
Fourth shaded function: positively sloping diagonal lines
The rotation returns to vertical lines for the fifth shaded function and repeats the order.
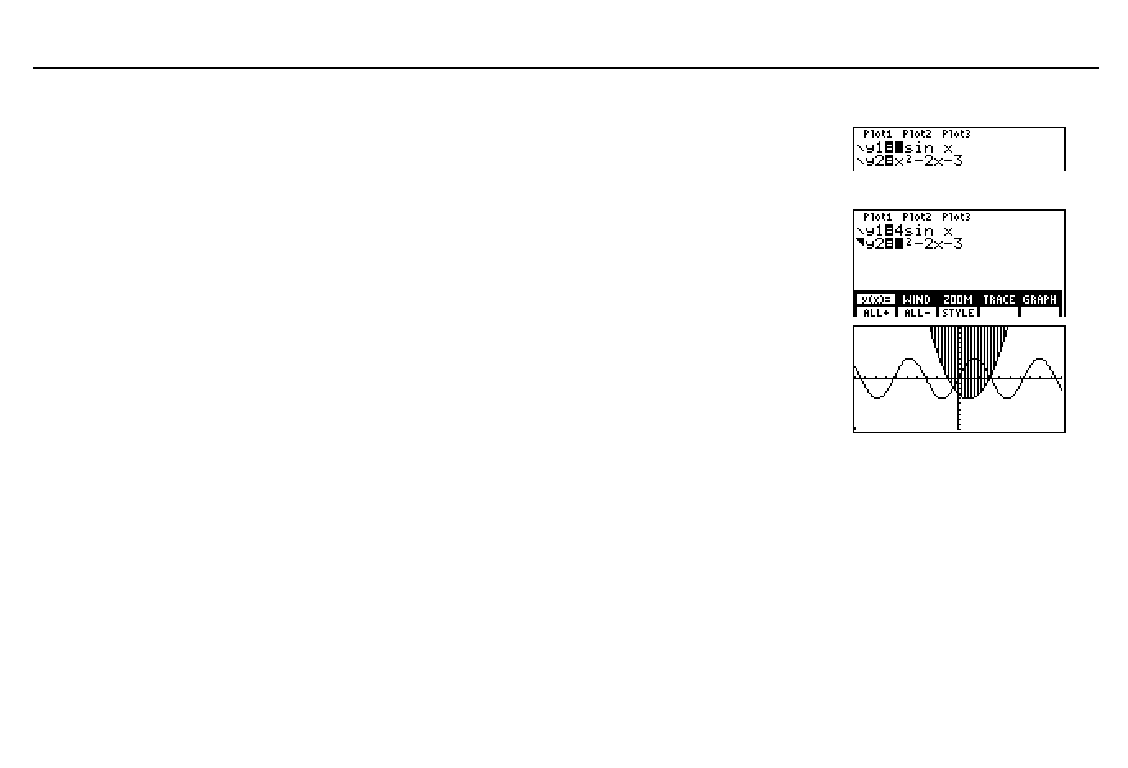
In the example,
¾
(shade
above) is selected for
y2
. All
window variables are set to
the default values (page 82).
If you assign
¾
or
¿
to a
function that graphs a family
of curves (page 86), the
same pattern rotation applies
to the members of the family
of curves.