First Edition Dated September, 2000 32
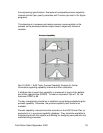
Corrective action consists of identifying and modifying the activity, situation,
or policy that is creating the out-of-control condition. Part of the power of
control charts is in helping correct process instabilities in a timely fashion,
before they result in defective products.
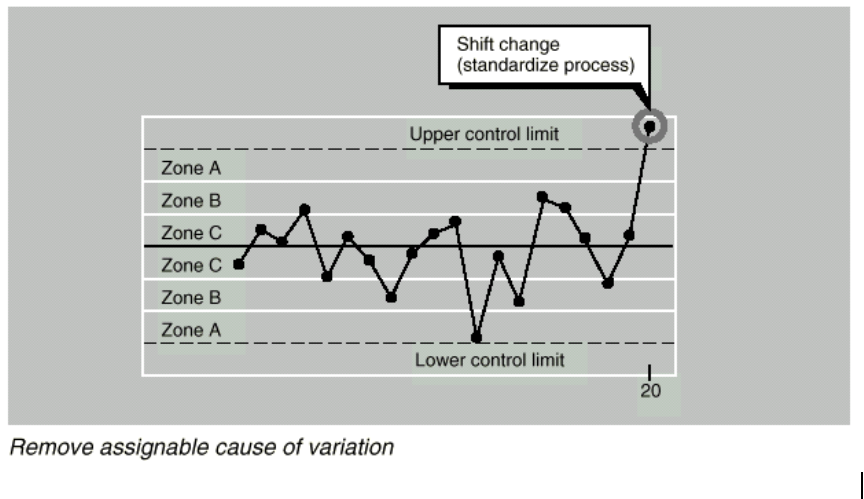
Though control charts do not really “control” processes, they are useful tools
that provide an early warning that corrective action should be taken.
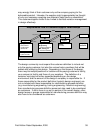
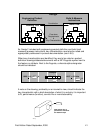
Samples corresponding to out-of-control plot points should be removed
from the control limit calculations, but should remain on the chart itself.
Once the process is stable (and out-of-control points removed from the
control limit calculations), the control limits should be set and not changed
until the process changes significantly. New plot points are to be compared
with the set control limits.
Section 4.3.2 Process capability shall be established for key
characteristics monitored with control charts. A key
characteristic is considered capable if its Cpk exceeds 1.33.
Other comparable measures of process capability may be
used.
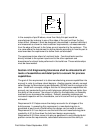
Process capability indexes such as Cpk compare the natural or common
cause variability of the process to the engineering specifications. These
measures usually compare information about the variability of the process
(usually measured by the standard deviation) and the process average to the
target or nominal value desired and the engineering limits. Cpk, or other
comparable indexes, can be used to evaluate the ability of a process to meet